|
Project Overview: In this project we will use statistics as a lever for developing empathy. We will take a statistical look at the group of 24 students in our class generate a dataset that includes 10-15 quantitative attributes about our life. We will use that dataset to the measures of central tendency and variability and calculate if any variables are correlated. In the third phase of the project, we will be randomly assigned the data from another anonymous student in the class and compare their data to the class measures of central tendency. They will create “Empathy Lenses” that display a meaningful graph and a short first person narrative to describe the graphs and the person in a positive light.
Essential Questions: How do graphs, averages, and outliers tell a story of a group of people? How can we see the world through another person’s eyes, using quantitative data analysis? Complete Project Description (including project calendar) |
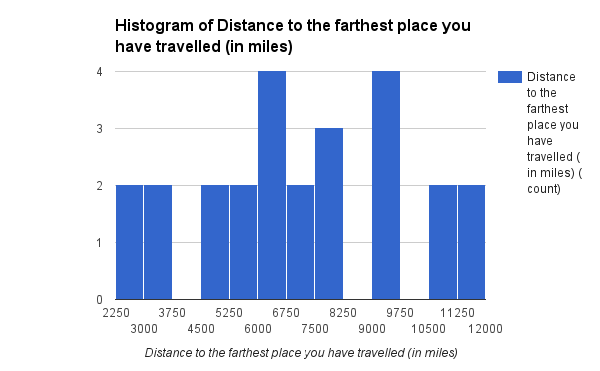
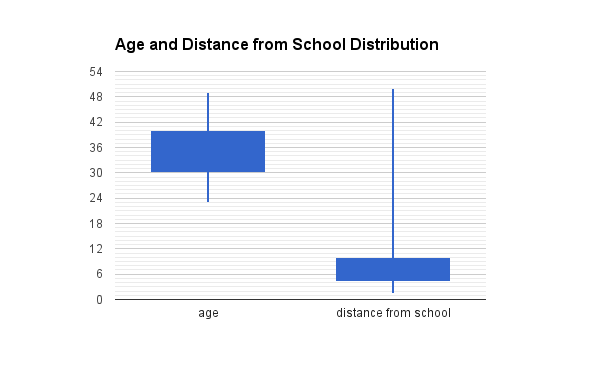
Univariate AnalysisStudents will look at measures of central tendency and variability in our variables as we attempt to understand our class better.
Period 1 Univariate Graphs Period 2 Univariate Graphs |
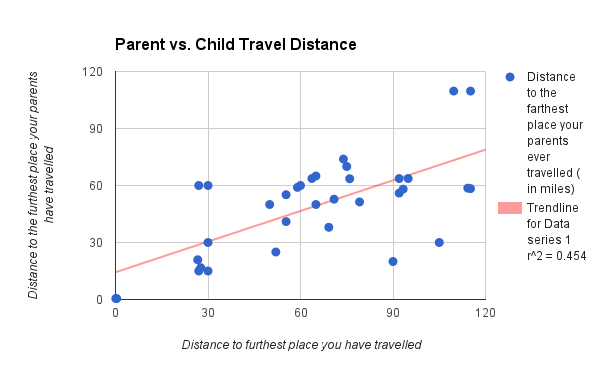
Bivariate AnalysisStudents will determine if any variables in our dataset are correlated and seek to understand what that correlation could mean for our context.
Period 1 Bivariate Graphs Period 2 Bivariate Graphs |
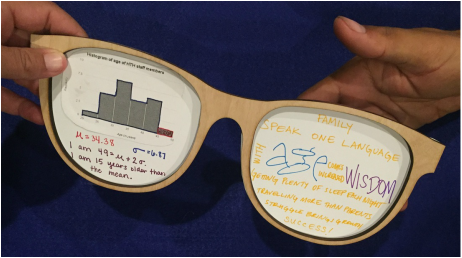
empathy LensStudents will receive another person's data anonymously and attempt to see the world through their eyes, quantitatively, and share their ideas in our final empathy lenses.
|
